LumiCycle
Luminometry for Circadian Biology
Click to Enlarge.
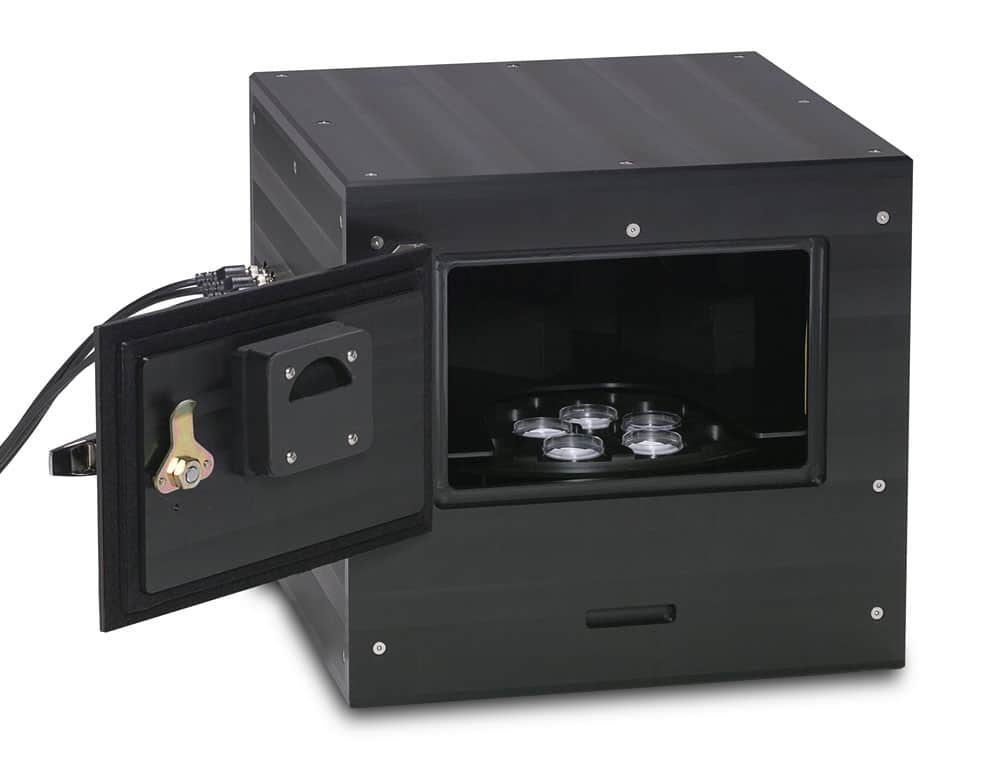
LumiCycle performs high-throughput luminometry on self-luminous tissues, such as those from transgenic animals containing the luciferase gene.
LumiCycle 32 Color records from 32 samples in 35-mm Petri dishes using 4 photomultipliers. Colored filters can be placed on 2 of the photomultipliers, so that 16 samples can be recorded simultaneously in 2 different colors.
LumiCycle 96 records from 96 samples in 4 24-well plates using 8 photomultiplier tubes.
LumiCycle In Vivo will record from an intact animal in a standard mouse cage using 2 photomultiplier tubes.
The systems are equipped with photon-counting photomultiplier tubes, each selected for low dark counts and high sensitivity in the green portion of the spectrum at which luciferase emits light.
The LumiCycle 32 and 96 fit inside a standard incubator. An internal fan circulates the incubator air to maintain the proper temperature within the chamber. The temperature is therefore as stable as the incubator can make it. The turntable and photon counting are fully automated. System setup and operation is straightforward. Online help files are included with the software.
In addition to its high-precision photon counting hardware, LumiCycle has the most flexible and easy-to-use software for the collection and analysis of circadian rhythms in luminometry data.
 Start and stop each counting channel asynchronously. You may, for example, start one experiment with 10 samples on one day, and start a second experiment with 22 samples the following day, stop the first experiment 5 days later and start yet a third set of dishes in their place.
- Interrupt the data collection to perform experimental manipulations on the samples (such as adding a drug). Once the treatment is complete, LumiCycle will pick up exactly where it left off.
- Flexible counting schedules, from once per hour, to once per minute.
- View records during the data collection process. A single window shows data for all 32 or 96 channels at once. Double-click on one of the graphs to view the data in greater detail (top figure).
- Analysis program (bottom figure) automatically compensates for baseline shifts and signal attenuation over the course of the trial. The dominant circadian period and phase can then be extracted (red curve). View periodograms and actograms, calculate phase shifts, extract periods with spectral or periodogram methods.
 Superimpose multiple records for comparison and figure preparation.
- Calculate rhythm parameters for the complete record, or for multiple subsets of the record. If, for example, a treatment is given halfway through a record that is expected to create a period or phase change, the two halves of the record can be analyzed separately and a phase shift calculated.
- While data collection is in progress, you may repeatedly copy the growing data files onto another computer (via a floppy or the network) and analyze the data collected so far for period and phase. Data collection continues uninterrupted until the end of the experiment.
- Extracted periods and phases can be exported to a text file for later manipulation in Excel or other statistics programs.
- Raw or baseline-subtracted records can be exported to ClockLab for further analysis using periodograms, actograms, and activity profiles.
